Provide two sample versions (DEIF and SIF) of influence function on the AUC.
IAUC(
  score,
  binary,
  threshold = 0.5,
  hypothesis = FALSE,
  testdiff = 0.5,
  alpha = 0.05,
  name = NULL
)
Arguments
- score
A vector containing the predictions (continuous scores) assigned by classifiers; Must be numeric.
- binary
A vector containing the true class labels 1: positive and 0: negative. Must have the same dimensions as 'score.'
- threshold
A numeric value determining the threshold to distinguish influential observations from normal ones; Must lie between 0 and 1; Defaults to 0.5.
- hypothesis
Logical which controls the evaluation of SIF under asymptotic distribution.
- testdiff
A numeric value determining the difference in the hypothesis testing; Must lie between 0 and 1; Defaults to 0.5.
- alpha
A numeric value determining the significance level in the hypothesis testing; Must lie between 0 and 1; Defaults to 0.05.
- name
A vector comprising the appellations for observations; Must have the same dimensions as 'score'.
Value
A list of objects including (1) `output`: a list of results with `AUC` (numeric), `SIF` (a list of dataframes) and `DEIF` (a list of dataframes)); (2) `rdata`: a dataframe of essential results for visualization (3) `threshold`: a used numeric value to distinguish influential observations from normal ones; (4) `test_output`: a list of dataframes for hypothesis testing result; (5) `test_data`: a dataframe of essential results in hypothesis testing for visualization (6) `testdiff`: a used numeric value to determine the difference in the hypothesis testing; (7) `alpha`: a used nuermic value to determine the significance level.
Details
Apply two sample versions of influence functions on AUC:
deleted empirical influence function (DEIF)
sample influence function (SIF)
The concept of influence function focuses on the deletion diagnostics; nevertheless, such techniques may face masking effect due to multiple influential observations.
To thoroughly investigate the potential cases in binary classification, we suggest end-users to apply ICLC and LAUC as well. For a complete discussion of these functions, please see the reference.
References
Ke, B. S., Chiang, A. J., & Chang, Y. C. I. (2018). Influence Analysis for the Area Under the Receiver Operating Characteristic Curve. Journal of biopharmaceutical statistics, 28(4), 722-734.
Examples
library(ROCR)
data("ROCR.simple")
# print out IAUC results directly
IAUC(ROCR.simple$predictions,ROCR.simple$labels,hypothesis = "True")
#> output is:
#> $AUC
#> [1] 0.8341875
#>
#> $SIF
#> $SIF$Pos
#>      Index  influence
#> [1,]    29 -0.8248417
#> [2,]    86 -0.8341875
#> [3,]    93 -0.5818511
#> [4,]   145 -0.6379258
#> [5,]   178 -0.8248417
#>
#> $SIF$Neg
#>      Index  influence
#> [1,]    10 -0.6513918
#> [2,]    25 -0.7911768
#> [3,]    49 -0.5116069
#> [4,]    77 -0.7266606
#> [5,]   108 -0.7911768
#> [6,]   193 -0.8019295
#>
#>
#> $DEIF
#> $DEIF$Pos
#>      Index  influence
#> [1,]    29 -0.8338074
#> [2,]    86 -0.8432548
#> [3,]    93 -0.5881755
#> [4,]   145 -0.6448598
#> [5,]   178 -0.8338074
#>
#> $DEIF$Neg
#>      Index  influence
#> [1,]    10 -0.6575370
#> [2,]    25 -0.7986407
#> [3,]    49 -0.5164334
#> [4,]    77 -0.7335159
#> [5,]   108 -0.7986407
#> [6,]   193 -0.8094948
#>
#>
#> test_output is:
#> $Testing
#> $Testing$Pos
#>      Index pivot.quantity
#> [1,]    29      10.453019
#> [2,]    86      10.753755
#> [3,]    93       2.633870
#> [4,]   145       4.438289
#> [5,]   178      10.453019
#>
#> $Testing$Neg
#>      Index pivot.quantity
#> [1,]    10       4.871608
#> [2,]    25       9.369721
#> [3,]    77       7.293669
#> [4,]   108       9.369721
#> [5,]   193       9.715729
#>
#>

data(mtcars)
glmfit <- glm(vs ~ wt + disp, family = binomial, data = mtcars)
prob <- as.vector( predict(glmfit, newdata = mtcars,type = "response"))
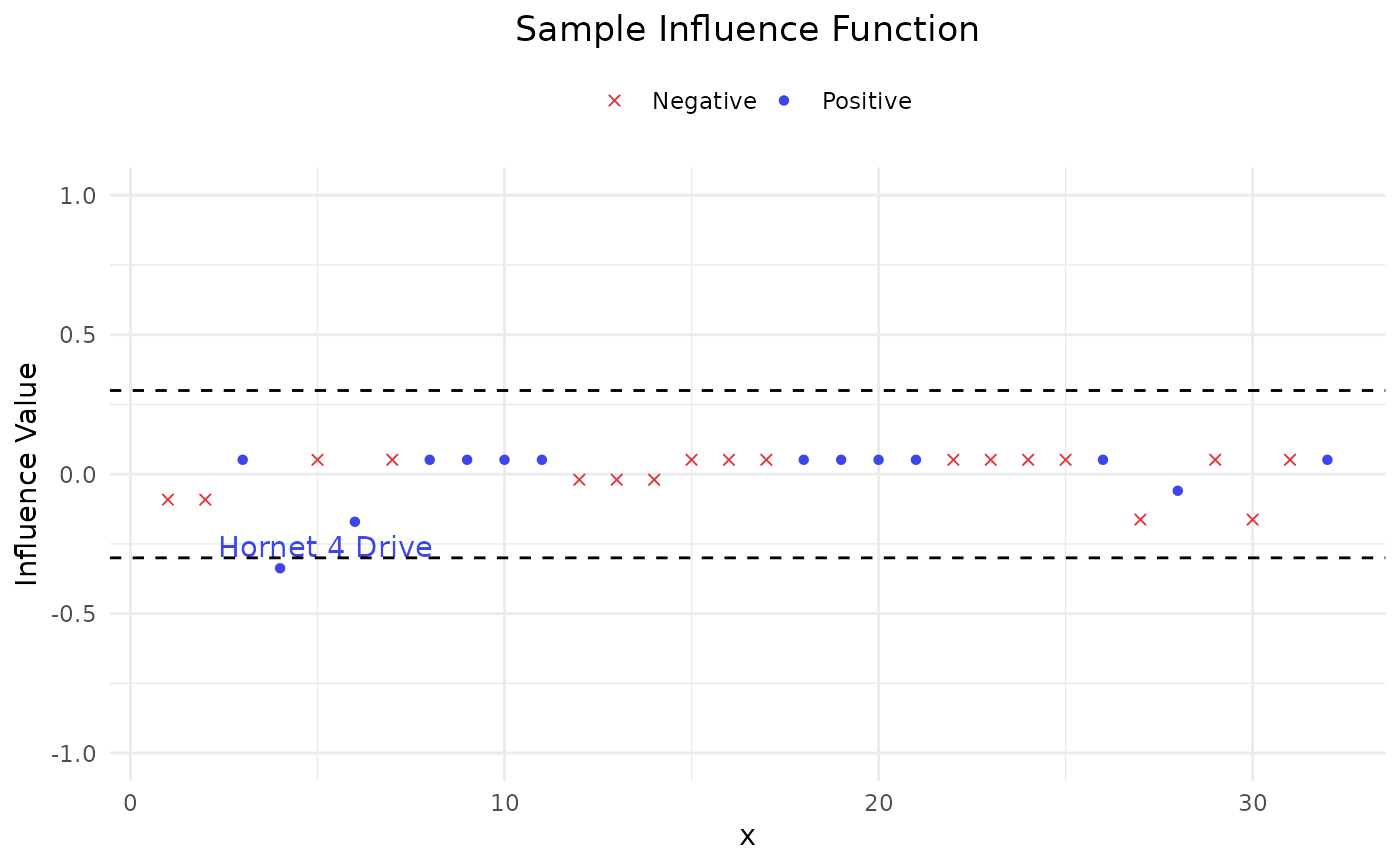
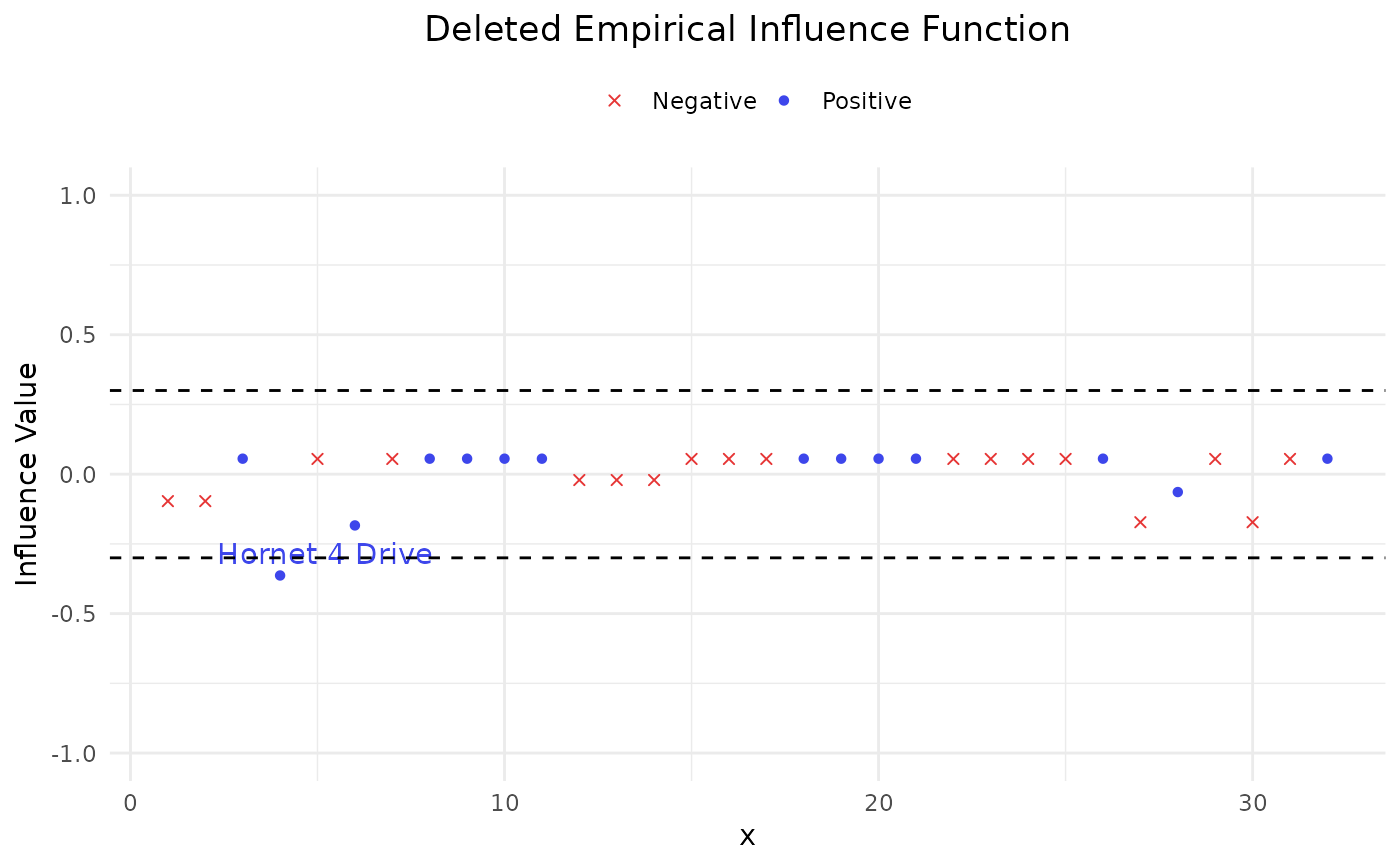
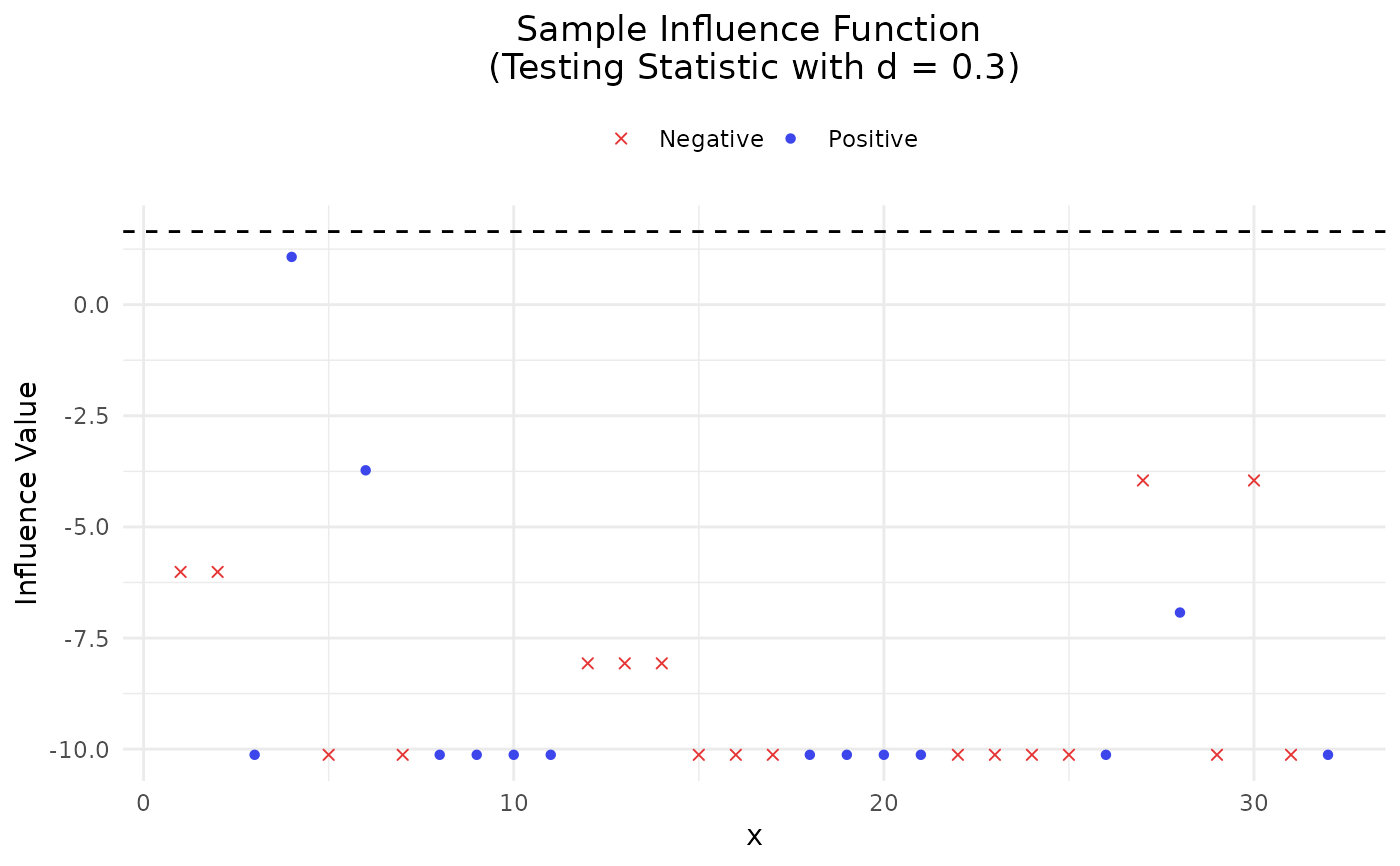
output <- IAUC(prob, mtcars$vs, threshold = 0.3, testdiff = 0.3,
               hypothesis = TRUE, name = rownames(mtcars))
# Show results
print(output)
#> output is:
#> $AUC
#> [1] 0.9484127
#>
#> $SIF
#> $SIF$Pos
#>                Index  influence
#> Hornet 4 Drive     4 -0.3373016
#>
#> $SIF$Neg
#>      Index influence
#>
#>
#> $DEIF
#> $DEIF$Pos
#>                Index  influence
#> Hornet 4 Drive     4 -0.3632479
#>
#> $DEIF$Neg
#>      Index influence
#>
#>
#> test_output is:
#> $Testing
#> $Testing$Pos
#>      Index pivot.quantity
#>
#> $Testing$Neg
#>      Index pivot.quantity
#>
#>
# Visualize results
plot(output)


